



1.Capital Rotation: BTC and Gold ETFs
In April 2026, Bitcoin weathered the escalating geopolitical tensions in Iran, clawing its way back to the $79,000 range. Since March, capital flows have reversed, moving out of gold ETFs and into Bitcoin ETFs. Profit-taking from surging gold prices combined with buybacks into relatively undervalued BTC has provided solid downside support for the cryptocurrency.
2. The "Low Peaks, Shallow Valleys" Cycle
While conventional "crypto winters" historically saw massive 70% to 80% drawdowns, the decline in this current cycle has been capped at just over 50% due to more modest gains during the preceding uptrend. Driven by the view that further downside is limited, we are seeing clear signs of dip-buying and a recovery in ETF inflows, even ahead of a full-fledged bull run.
3. Worst-Case Scenarios and Signs of a Bottom
The market's resilience against worst-case "black swan" events—such as the potential blockade of the Strait of Hormuz—signals a macro bottom based on historical trends. Although regulatory risks and Federal Reserve policy shifts remain on the radar, the market has likely passed its worst phase after a solid period of price consolidation.
Bitcoin (BTC) rebounded at $60,000 in February, but then stalled due to the worsening situation in Iran. However, it stabilized around $63,000 and recovered to the $79,000 range on expectations of a ceasefire and peace talks. A clear breakout from the $79,000 to $80,000 resistance zone would likely indicate a bottoming out.
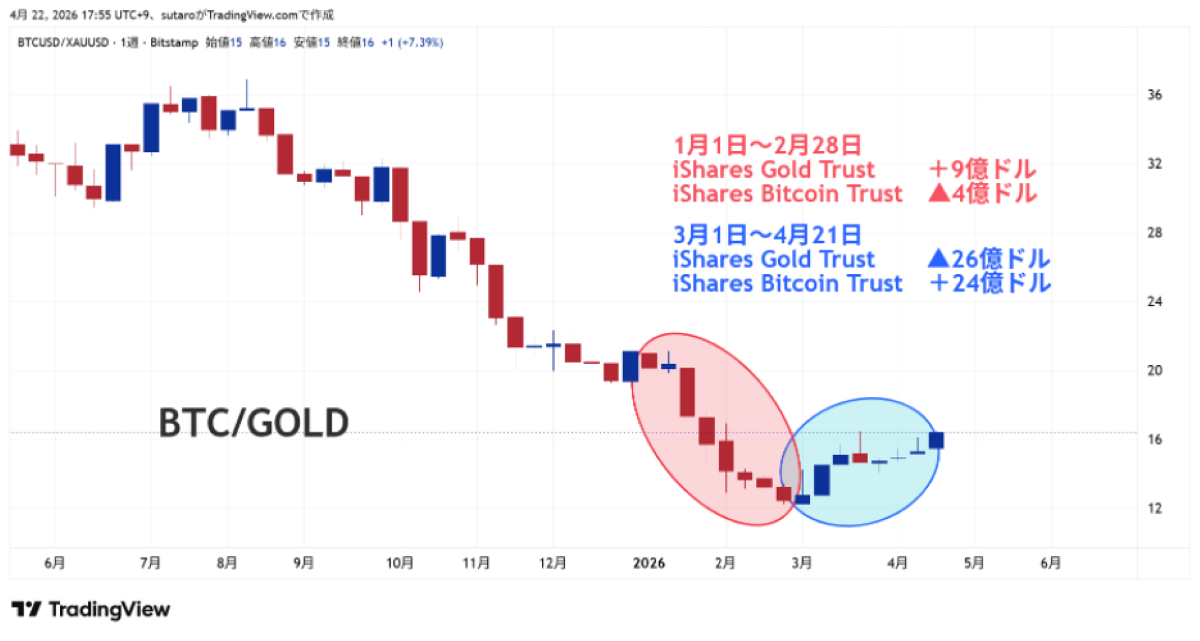
Since the attack on Iran at the end of February, Bitcoin has outperformed gold, leading to talk of a "re-evaluation of digital gold." While there may be some truth to this, the reality is likely a reversal of the "gold buying, Bitcoin selling" trend that has continued since the latter half of last year, primarily in the ETF market. The relative price of Bitcoin and gold continued to decline after peaking in August of last year, but has been rising since the end of February.
Looking at the fund flows for BlackRock's gold ETF and Bitcoin ETF, in January and February, gold ETFs saw an inflow of $900 million, while Bitcoin ETFs saw an outflow of $400 million. Conversely, from March onwards, the situation completely reversed, with gold ETFs down $2.6 billion and Bitcoin ETFs up $2.4 billion.
This suggests that profit-taking sales occurred in gold, whose price had risen too high due to the worsening situation in Iran, while buying occurred in Bitcoin, which was undervalued. If Bitcoin was bought due to worsening geopolitical risks, then this doesn't explain buying during ceasefires or progress in peace negotiations.

